Mere days after the popular media began dusting off references to the famous “Buffett Indicator”, markets hemorrhaged trillions of dollars in market value as part of a global stock selloff.
The immediate investor concern as clear as ever: is this a healthy correction or a significant step in the direction of financial and economic decline?
In the world of investing, few names command as much respect and curiosity as Warren Buffett. Known for his legendary investment acumen, Buffett’s insights have guided countless investors. Among his many contributions, one metric stands out: the Buffett Indicator.
This indicator, which compares the total value of the stock market to the country’s GDP, has historically proven to be a powerful tool for assessing market valuations. But what does it really tell us, and how should investors interpret it today?
The Buffett Indicator first gained prominence during the early 2000s when Warren Buffett himself referred to it as “probably the best single measure of where valuations stand at any given moment.” The concept is simple: it divides the total stock market capitalization by the gross domestic product (GDP) of a country. The idea is to gauge whether the market is overvalued or undervalued compared to the economy’s overall output.
Historically, the indicator has fluctuated significantly. For instance, during the dot-com bubble in the late 1990s, the Buffett Indicator soared, indicating extreme overvaluation. Conversely, during the market lows of the 2008 financial crisis, it suggested deep undervaluation. This historical ebb and flow underscore the indicator’s utility in highlighting periods of market excess or fear.
Today, the Buffett Indicator continues to be a critical tool for investors. In recent years, the indicator has reached unprecedented levels, driven by factors such as low-interest rates, massive liquidity injections, and robust corporate earnings. As of mid-2024, the indicator stands near its historical highs, prompting questions about the sustainability of current market valuations.
Breaking it Down
We can deconstruct the Buffett Indicator by factoring the metric across a variety of financial and economic indicators. To understand its current relevance, let’s delve into some of the components driving the Buffett Indicator. The formula may be broken down into several factors:
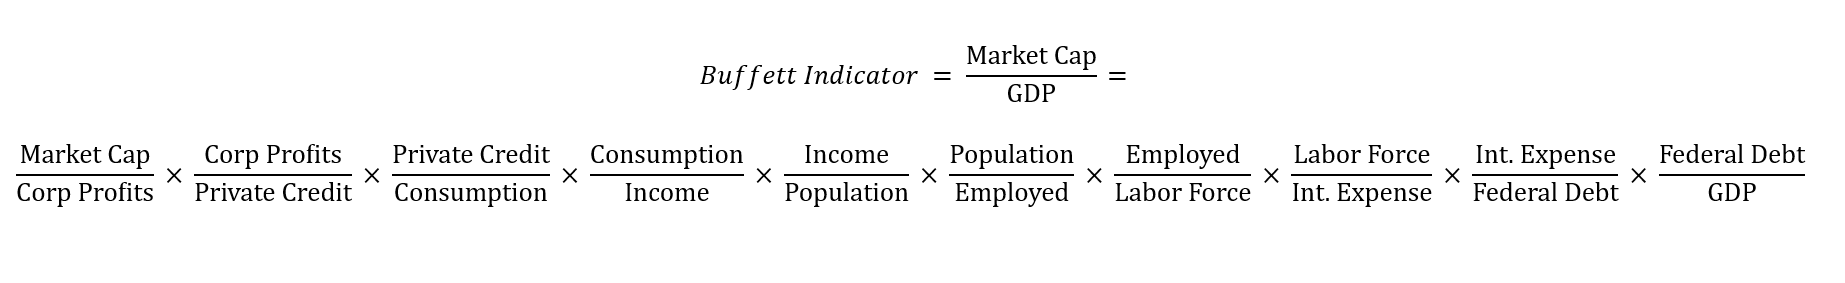
This framework breaks the concept of the Buffett Indicator down into discrete economic and financial indicators. A summary of each ratio, in order, is provided below:
- Total Price Multiple: Total stock market value per unit of corporate profit.
- Yield on Private Credit: Total corporate profit generated per dollar of private credit.
- Consumption Burden: The level of private credit required for each dollar of consumption.
- Consumption Rate: Consumption per dollar of personal income.
- Average Personal Income: Income per person (total population).
- Dependency Ratio: The number of people for every employed person.
- Employment Rate: The number of employed persons for each member of the labor force.
- Interest Expense Coverage: The number of laborers for every dollar of federal interest expense.
- Effective Interest Rate on Federal Debt: Interest expense per unit of federal debt
- Federal Debt to GDP): Ratio of federal debt to GDP
These components collectively provide a nuanced view of the economic forces at play. For example, high corporate profits relative to GDP can inflate the indicator, suggesting potential overvaluation. Similarly, changes in private credit and consumption patterns can signal shifts in economic stability.
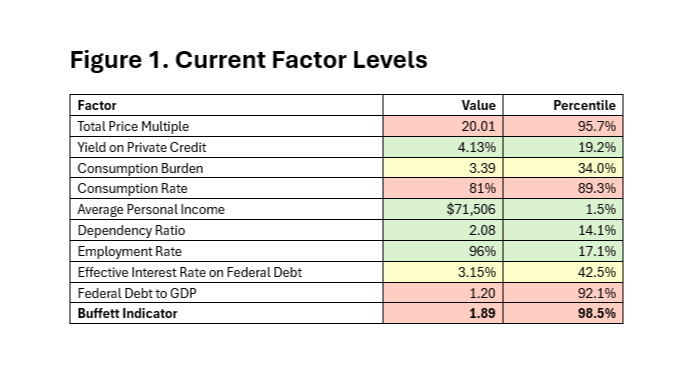
The total market value of the Wilshire 5000 index currently sits at a multiple of 20x total corporate profits and 1.89x GDP. Both metrics are near their all-time highs, ranking in the top 96% and 99% of historical time periods looking back to 1989. These levels were last seen in Q2 2000 (24x profits) and Q1 2022 (19x profits). Interestingly, in 2008, the Buffett Indicator (1.06x GDP) and price multiple (13x profits) were not nearly as elevated as in 2000 and 2022. Despite the concerning levels for valuation, it’s important to consider all the factors at play.
Differentiating the Current Era from Past Bubbles
The price and corporate profit dynamics in 2000 and 2008 were very similar. In the year leading up to the high valuations in 2000 and 2008, the stock market appreciated by 21.5% and 16.7%, respectively, while corporate profits fell by -7.9% and -5.6%.
In contrast, in the year leading up to the high valuations of 2022 and 2024, the stock market appreciated by 22.8% and 21.6%, while corporate profits grew by 4% and 1.1%. Up to this point, labor markets have proven very strong and resilient with low levels of unemployment, real wage growth, and lower dependency ratios, along with a better balance of profits and private credit and less reliance on private credit for consumption.
Federal Debt, Private Credit, and Market Dynamics
In 2008, leverage told the story as private credit exploded. Extravagant private debt levels yielded only $0.02 of corporate profit per $1 of debt, with private credit representing 4.4x the amount of personal consumption expenditure, and personal consumption exceeding 80% of personal income. Conversely, in 2000, the market experienced a total collapse of corporate profits, with stock prices appreciating by 21.5% while corporate profits declined by -7.9%.
A significant concern in 2024 is the level of federal debt and the interest expense on that debt. The federal debt-to-GDP ratio is near an all-time high of 1.92x, and the share of the interest expense per employed person is at an all-time high. The saving grace is that interest rates are historically low, which has kept the interest expense in a more manageable range.
That said, the total credit landscape, consisting of private credit and public debt, has remained surprisingly unchanged over the past 15 years, with the ratio of public and private credit to GDP consistently around 3.5x GDP.
Over this time, there has been a rotation toward public debt versus private credit. Historically, private credit has represented 3x to 4x the amount of public debt. However, in recent years, this ratio has decreased to approximately 2x the amount of public debt, indicating a shift in the balance between private and public debt.
The counter-cyclical nature of public debt, where government borrowing increases during economic downturns to stimulate growth, contrasts with the pro-cyclical behavior of private credit, which tends to expand during economic booms and contract during busts.
The substantial rise in public debt over the past four years has helped cushion the economy in response to the pandemic-induced recession but also raises concerns about long-term sustainability. This increase in public debt has provided stability in times of economic stress, unlike other periods when private credit was more dominant, leading to more volatile economic cycles. Despite long-term debt concerns, current fundamentals and treasury demand mitigate immediate risks.
Today’s Analysis & Outlook
The context of today’s market valuation does appear to be very different from the conditions of the most recent financial crises, but we will be keeping a close eye on corporate earnings and profits.
The Federal Reserve has effectively cooled the labor market, but corporate profits remain strong, and GDP growth is positive. The recent jobs report showed a slowdown, but still exhibits modest employment growth and only a slight rise in the unemployment rate. Certain elements of the economy do exhibit weakness such as home sales and durable goods orders, but consumer fundamentals are strong, with consistent real wage growth and good disposable income, while corporate earnings are robust.
The higher level of earnings quality along with deeper, more diversified, financial markets substantiate systemically higher earnings multiples of around 20x earnings compared to historical multiples nearer to 15x earnings.
It is almost certain the Federal Reserve will cut interest rates between 25-50bps in September, but it is important that the central bank decision remains data-driven and rational. Overly aggressive rate cuts could fuel a self-fulfilling prophecy by playing into investor fear mechanisms and narratives and fuel more selloffs and could weaken the economy due to reduced interest income generation.
Overconcentration in a few sectors highlights the need for balanced, diversified portfolios. Portfolio diversification and communication is essential for navigating economic uncertainties and achieving long-term strategic goals.
Conclusion
The Federal Reserve’s potential policy rate cut could significantly lower borrowing costs, encouraging corporate investment and boosting earnings growth. It would reduce debt servicing expenses for both companies and the federal government, helping to balance public and private debt levels. Additionally, lower rates would stimulate consumer spending by reducing the cost of loans, enhancing corporate revenues, and supporting high market valuations. This move would also attract foreign investment and maintain the U.S.’s competitive edge globally, fostering economic stability and growth. By bolstering earnings and improving financial conditions, this could bring valuations closer to reasonable levels without necessitating a major market downturn.
It’s important to remember that during times of market uncertainty, the best strategy is to focus on what you can control: maintain disciplined savings rates, monitor spending patterns, stick to your budgeting, and regularly update your financial plans. This approach is most effective in helping you to ensure that you remain on track to meet your long-term financial goals, regardless of market fluctuations.
As always, please do not hesitate to reach out to your Fiduciary Investment Advisor should you have any questions or concerns regarding your investments or financial planning.